Predict Next Purchase
In this example, we will generate labels on online grocery orders provided by Instacart using Compose. The labels can be used to train a machine learning model to predict whether a customer will buy a specific product within the next month.
If you plan to run this notebook, you can use the following command at the root directory of the repository.
jupyter notebook docs/source/examples/predict-next-purchase/example.ipynb
Load Data
[1]:
%matplotlib inline
import composeml as cp
import data
The data hosted here will be downloaded automatically into the data module of this notebook unless it already exist. Once the data is in place, we can preview the grocery orders to see how they look.
[2]:
df = data.load_orders(nrows=1000000)

df.head()
[2]:
| order_id | product_id | add_to_cart_order | reordered | product_name | aisle_id | department_id | department | user_id | order_time | |
|---|---|---|---|---|---|---|---|---|---|---|
| 0 | 120 | 33120 | 13 | 0 | Organic Egg Whites | 86 | 16 | dairy eggs | 23750 | 2015-01-11 08:00:00 |
| 1 | 120 | 31323 | 7 | 0 | Light Wisconsin String Cheese | 21 | 16 | dairy eggs | 23750 | 2015-01-11 08:00:00 |
| 2 | 120 | 1503 | 8 | 0 | Low Fat Cottage Cheese | 108 | 16 | dairy eggs | 23750 | 2015-01-11 08:00:00 |
| 3 | 120 | 28156 | 11 | 0 | Total 0% Nonfat Plain Greek Yogurt | 120 | 16 | dairy eggs | 23750 | 2015-01-11 08:00:00 |
| 4 | 120 | 41273 | 4 | 0 | Broccoli Florets | 123 | 4 | produce | 23750 | 2015-01-11 08:00:00 |
Generate Labels
Now with the grocery orders loaded, we are ready to generate labels for our prediction problem.
Create Labeling Function
To get started, we define the labeling function that will return whether a customer purchased the product in a given month.
[3]:
def bought_product(df, product_name):
    purchased = df.product_name.str.contains(product_name).any()
    return purchased
Construct Label Maker
With the labeling function, we create the label maker for our prediction problem. To process one month of orders for each customer, we set the target_entity to the customer ID and the window_size to one month. When window size is set to 1MS, the window size will end on the first day of the next month. Alias definitions are listed here.
[4]:
lm = cp.LabelMaker(
    target_entity='user_id',
    time_index='order_time',
    labeling_function=bought_product,
    window_size='1MS',
)
Search Labels
Next, the label maker will search through the data continously to label whether a customer bought bananas in a given month. This happens when we use LabelMaker.search and set the product_name to bananas. If you are running this code yourself, feel free to expirement with other products (e.g. limes, avocados, etc.) and different time frames!
[5]:
lt = lm.search(
    df.sort_values('order_time'),
    minimum_data='2015-01-01',
    num_examples_per_instance=-1,
    product_name='Banana',
    verbose=True,
)

lt.head()
Elapsed: 00:29 | Remaining: 00:00 | Progress: 100%|██████████| user_id: 19477/19477
[5]:
| user_id | time | bought_product | |
|---|---|---|---|
| id | |||
| 0 | 4 | 2015-01-01 | False |
| 1 | 7 | 2015-01-01 | False |
| 2 | 10 | 2015-01-01 | False |
| 3 | 10 | 2015-02-01 | False |
| 4 | 13 | 2015-01-01 | False |
Describe Labels
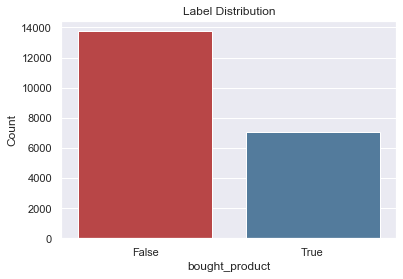
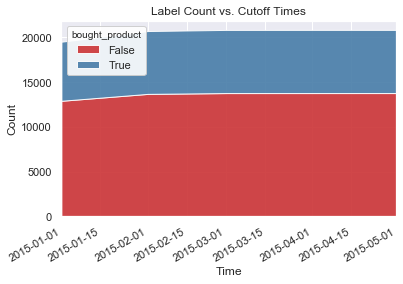
With the generate label times, we can use LabelTimes.describe to print out the distribution with the settings and transforms that were used to make these labels. This is useful as a reference for understanding how the labels were generated from raw data. Also, the label distribution is helpful for determining if we have imbalanced labels.
[6]:
lt.describe()
Label Distribution
------------------
False     13752
True       7044
Total:    20796


Settings
--------
gap                            <MonthBegin>
label_type                         discrete
labeling_function            bought_product
minimum_data                     2015-01-01
num_examples_per_instance                -1
target_entity                       user_id
window_size                    <MonthBegin>


Transforms
----------
No transforms applied

